" width="35px"><path d="M 30.802 16.132 L 22.02 7.279 L 16.302 13.448 C 14.577 11.925 12.285 10.944 9.812 10.944 C 7.34 10.944 6.619 11.357 5.254 12.08 C 7.314 7.408 12.027 4.078 17.513 4.078 C 22.999 4.078 30.158 9.344 30.802 16.132 Z M 11.692 29.502 L 8.911 32.754 C 11.461 34.2 14.371 35 17.513 35 L 17.513 34.974 C 23.462 34.974 28.742 32.006 31.884 27.489 L 28.896 24.521 C 28.33 25.424 27.66 26.276 26.913 27.024 C 24.492 29.399 21.196 30.87 17.513 30.87 C 13.68 30.87 11.692 29.502 11.692 29.502 Z M 6.026 24.417 C 5.202 22.998 4.61 21.449 4.275 19.797 C 4.507 18.3 5.357 16.984 6.542 16.132 C 7.443 15.461 8.576 15.074 9.787 15.074 C 10.997 15.074 11.461 15.28 12.182 15.642 C 12.645 15.874 13.083 16.184 13.444 16.519 L 6.001 24.417 Z M 6.052 30.69 L 6.026 30.69 L 22.149 13.241 L 33.532 24.624 C 34.485 22.43 35 20.029 35 17.5 C 35 7.821 27.171 0 17.513 0 C 7.855 0 0 7.795 0 17.474 C 0.335 25.047 4.198 29.115 6.052 30.69 Z" fill="rgb(255, 255, 255)" height="34.99999881227488px" id="HZDyp0Kro" transform="translate(0 0)" width="35px"/></g></svg>)
2022
Challenge
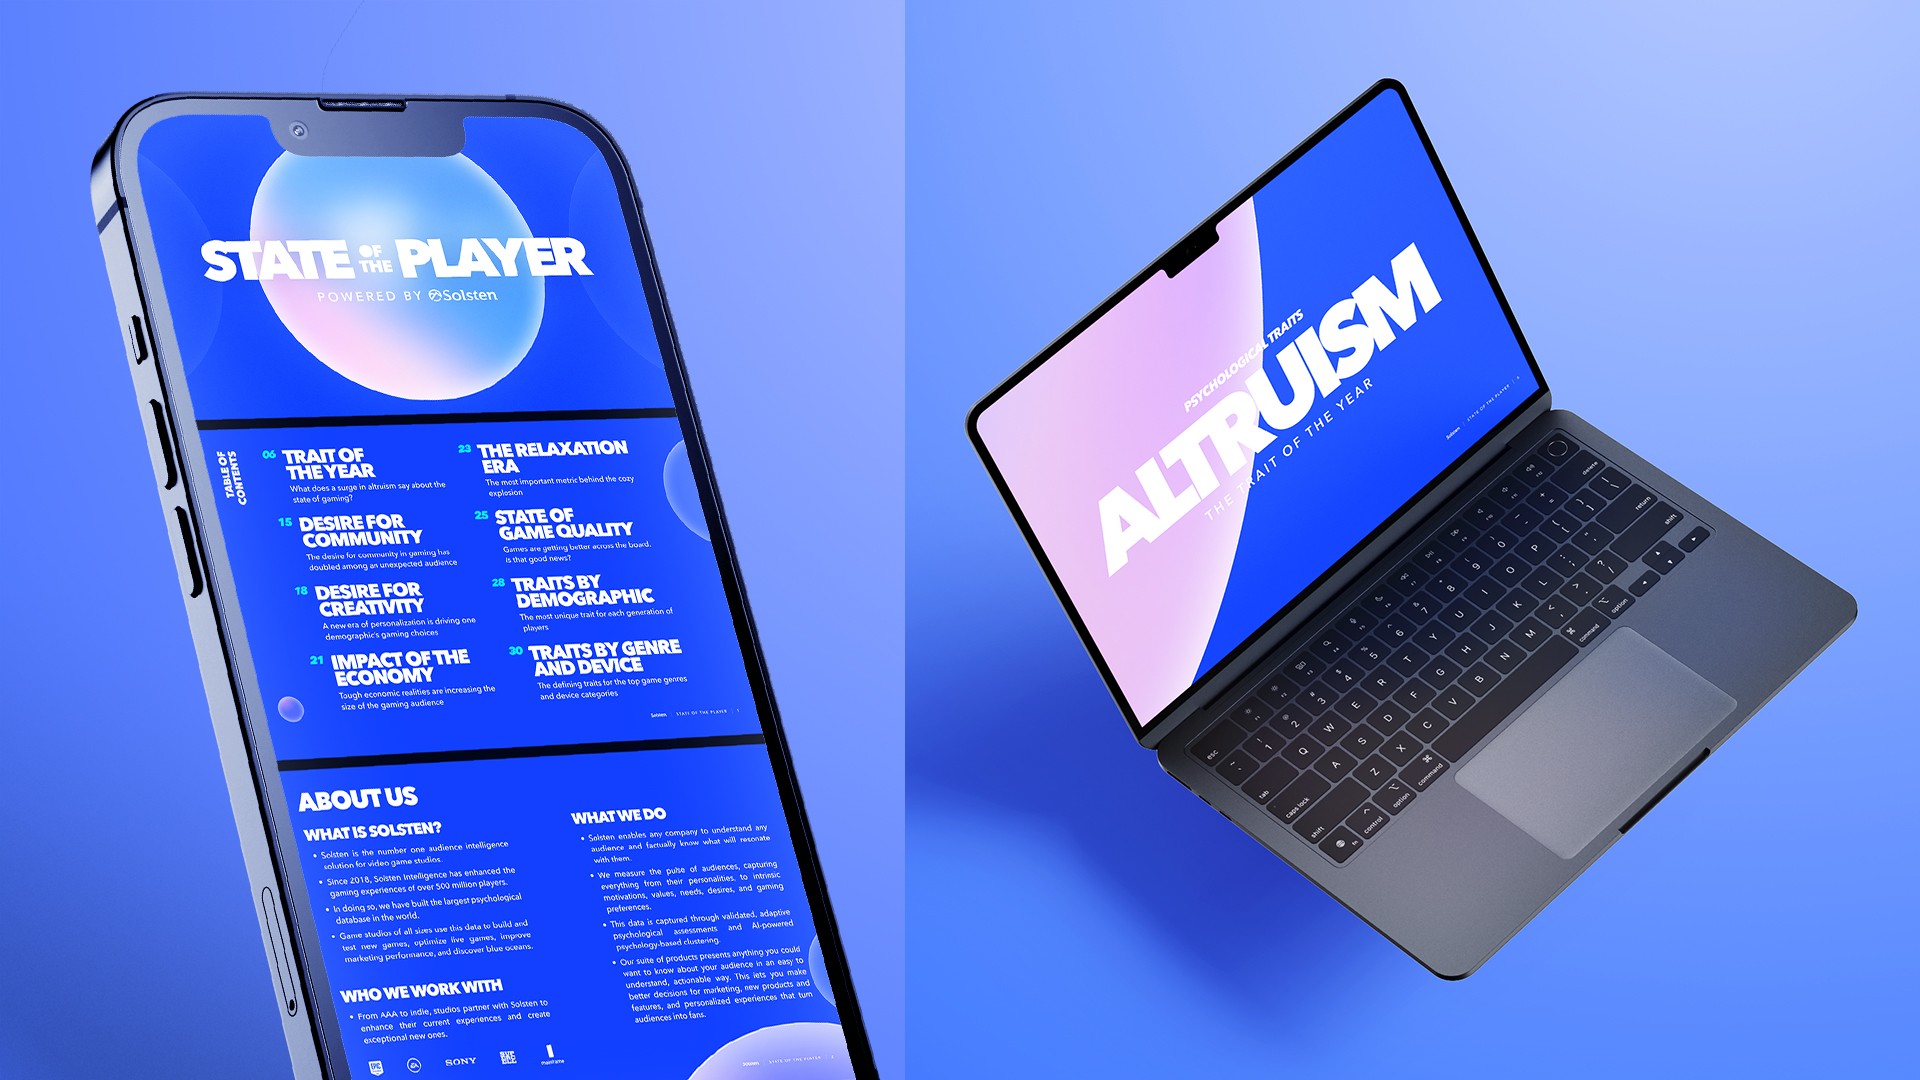
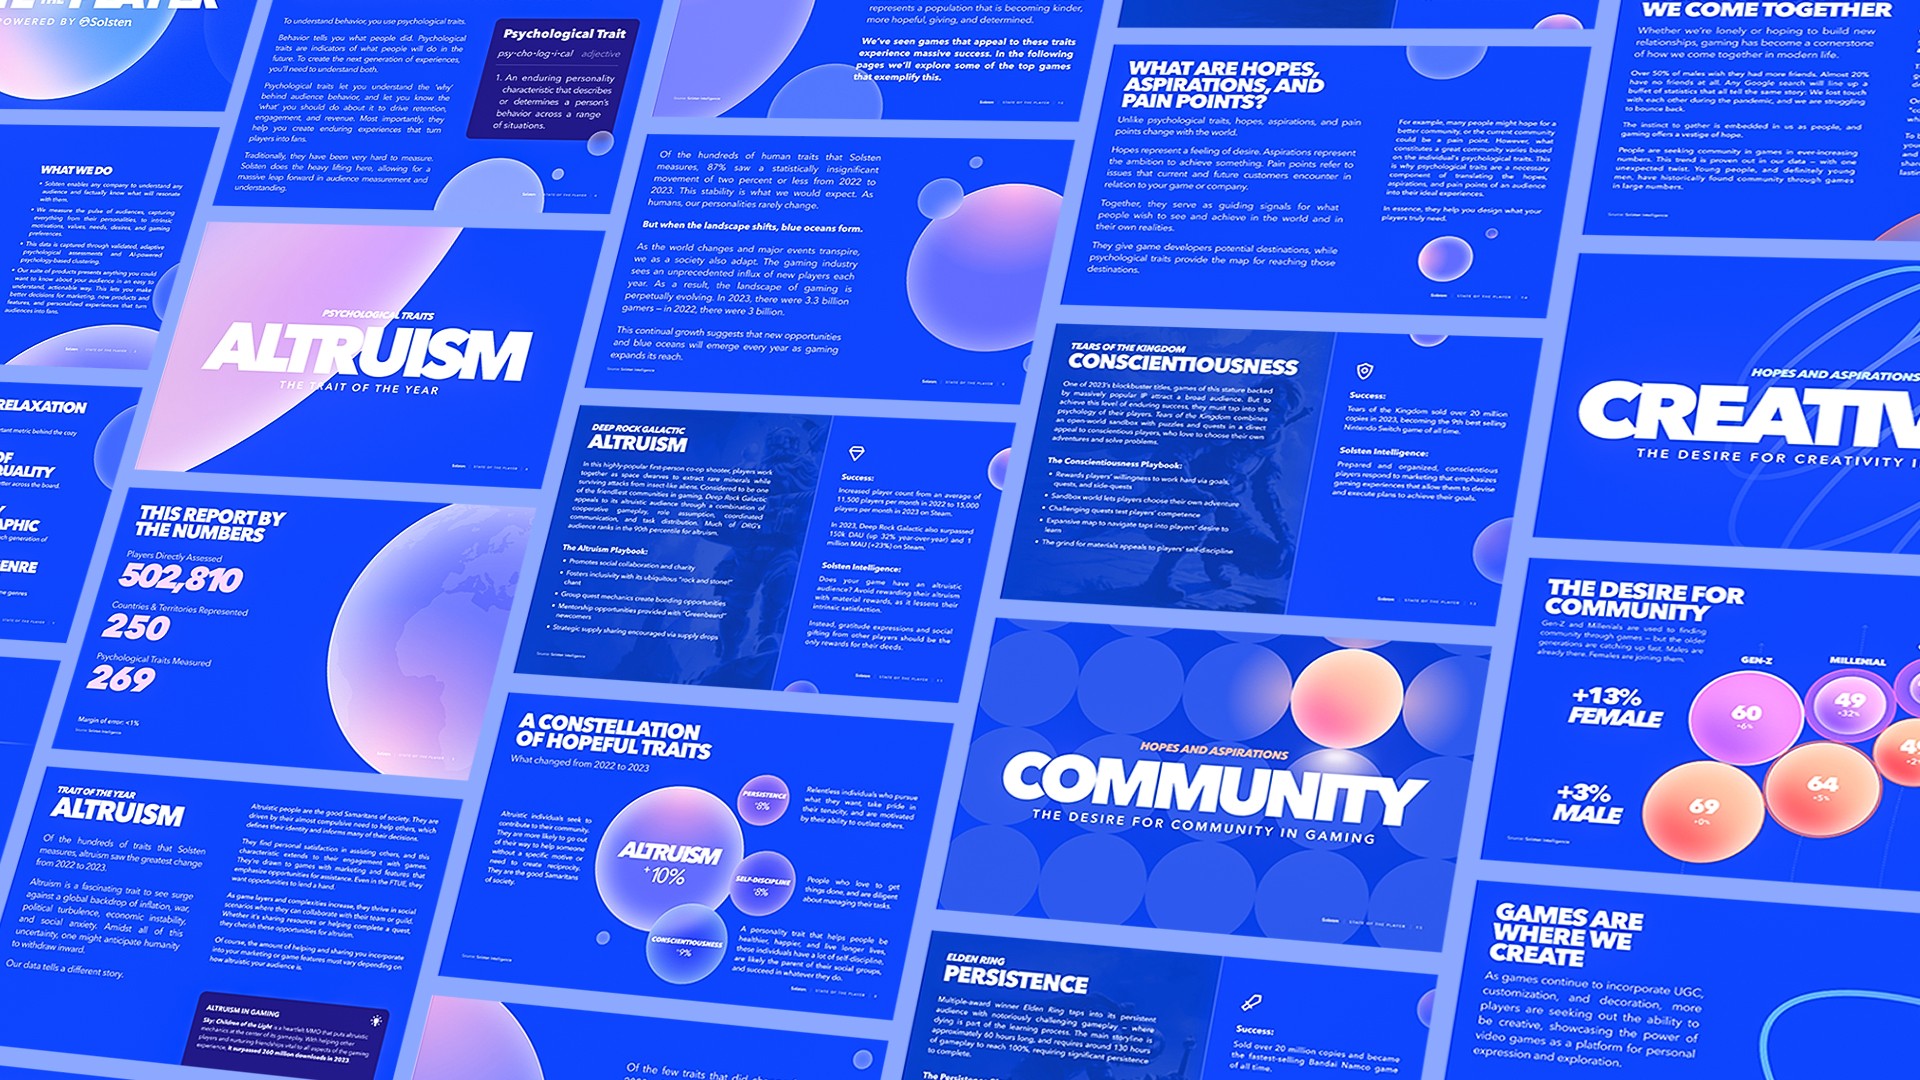
Solsten sought to transform one of the world's largest gaming psychology datasets into a compelling thought-leadership report capable of communicating behavioral insights gathered from more than 500,000 players across 250 countries and territories. The challenge was presenting complex analytical findings in a format that felt approachable, engaging, and visually memorable.
Role
Design Lead
Deliverables
Marketing Assets
Solution
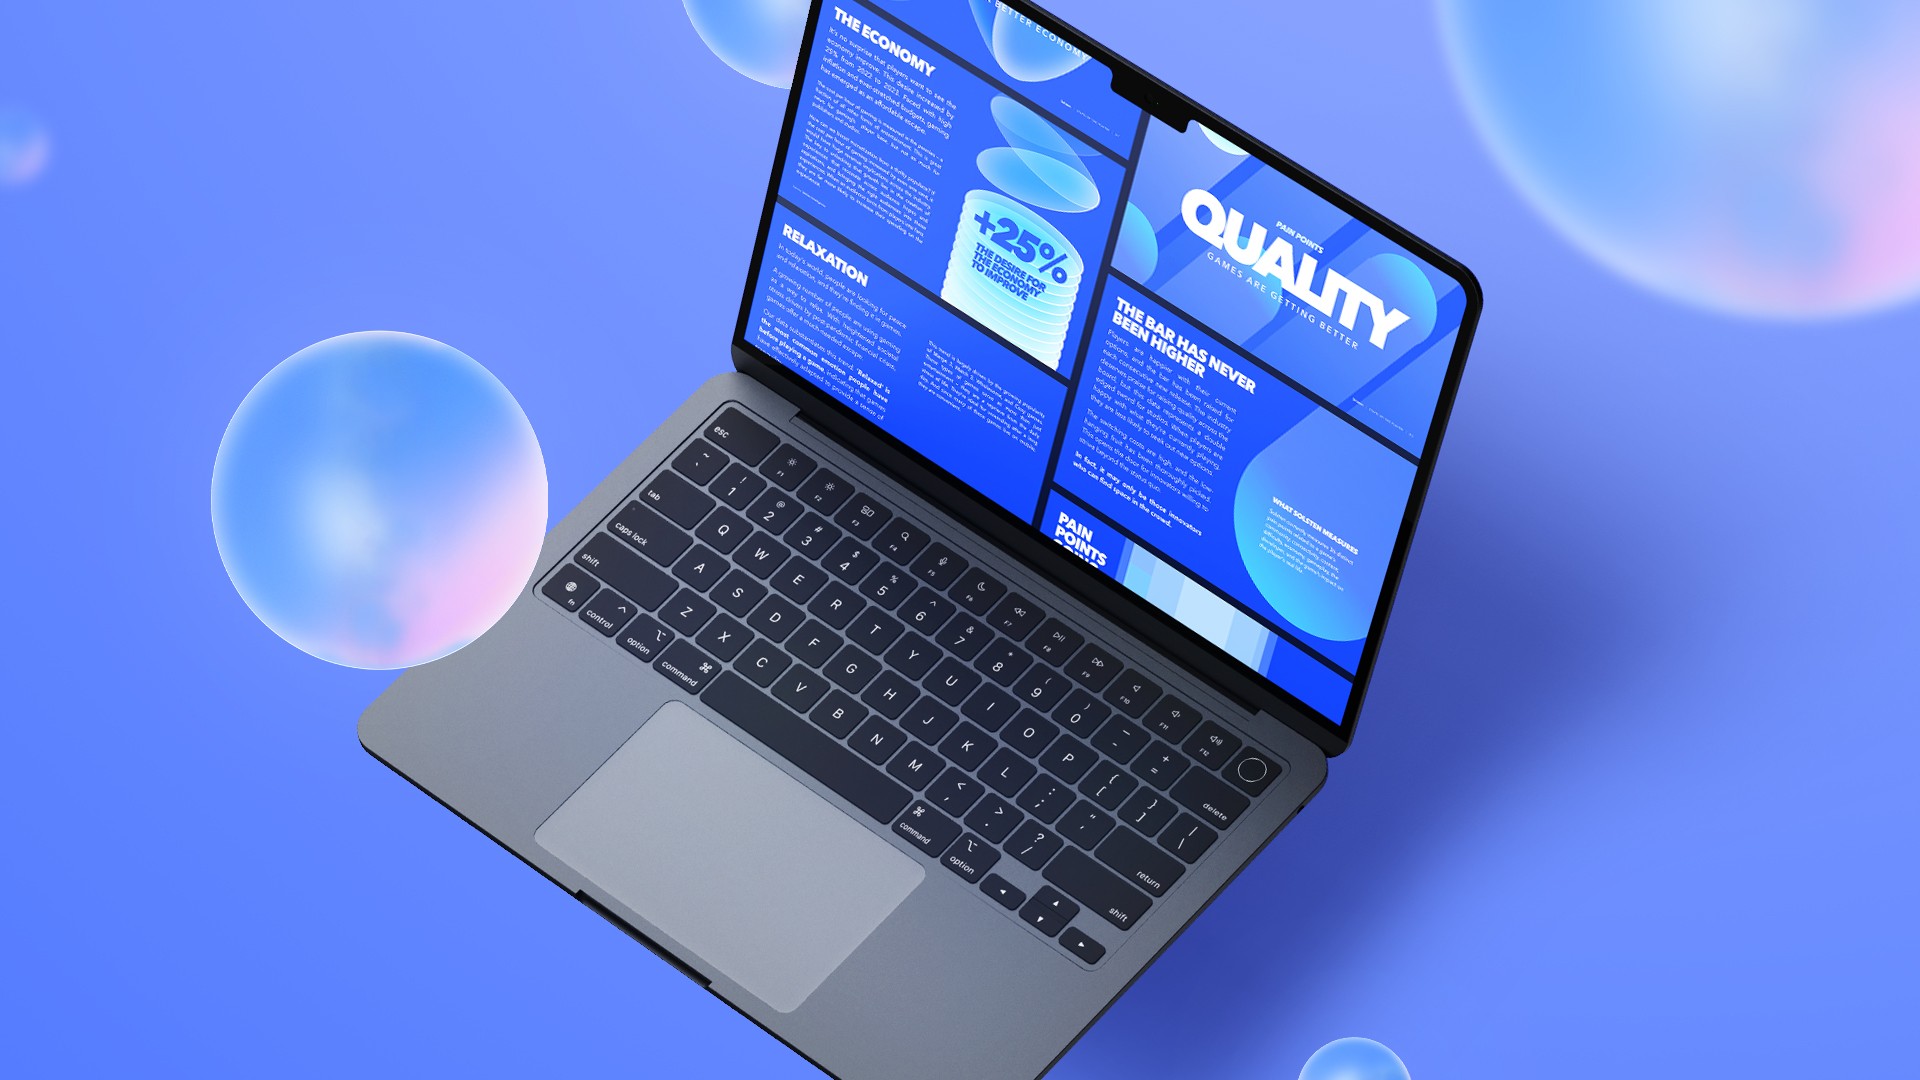
To support the report's focus on human behavior and player psychology, we developed a visual system inspired by the concept of individual traits existing within interconnected "bubbles." This approach informed the design language throughout the report, creating a cohesive experience that balanced data visualization, storytelling, and brand expression while helping audiences navigate complex insights.
Challenge
Solsten sought to transform one of the world's largest gaming psychology datasets into a compelling thought-leadership report capable of communicating behavioral insights gathered from more than 500,000 players across 250 countries and territories. The challenge was presenting complex analytical findings in a format that felt approachable, engaging, and visually memorable.
Role
Role
Design Lead
Design Lead
Deliverables
Deliverables
Marketing Assets
Marketing Assets
Tools Used
Tools Used
Figma, Photoshop, Illustrator, After Effects
Figma, Photoshop, Illustrator, After Effects
Solution
To support the report's focus on human behavior and player psychology, we developed a visual system inspired by the concept of individual traits existing within interconnected "bubbles." This approach informed the design language throughout the report, creating a cohesive experience that balanced data visualization, storytelling, and brand expression while helping audiences navigate complex insights.
Solution
To support the report's focus on human behavior and player psychology, we developed a visual system inspired by the concept of individual traits existing within interconnected "bubbles." This approach informed the design language throughout the report, creating a cohesive experience that balanced data visualization, storytelling, and brand expression while helping audiences navigate complex insights.